Introducing PktmonGUI: Packet Capture with Process Attribution
In my previous post, I discussed Windows’ built-in tool, Pktmon.
A friend who read that post came up to me and exclaimed that while it’s a great tool to be familiar with, he didn’t want to be bothered with remembering all the different flags one needs to input to the tool. “Why isn’t there a GUI version to it?”, he pondered out loud.
The weekend was upon us, and I had a Claude Pro subscription. So hold my beer… 🍺
Enter PktmonGUI !

The Origin Story
My friend’s request was the push, but the feature I actually wanted was something I’d been missing for a long time.
Every couple of years, I’d face a situation where suspicious traffic would emanate from a Windows host, such as sporadic beaconing to a malicious IP, or DNS requests to a flagged domain. While we could figure out which host was sending the traffic, we were stumped as to which process on the host was sending the traffic. Even if we installed Wireshark - that question would remain unanswered.
What PktmonGUI is
PktmonGUI is a graphical front end for Pktmon; it’s one portable file, PktmonGUI.exe: no installer, no driver, nothing added to the machine. It runs on .NET Framework 4.7.2 (which every supported Windows version already has). Copy it to the box, run it as administrator, capture packets, close it, and the machine is left the way you found it.
That last point matters more than it sounds, and I’ll come back to it.
What makes it worth using
It answers “which process sent this?”
Wait… what?! I thought you said Pktmon was a packet sniffer.
Exactly, and that’s the point: Pktmon doesn’t record which program a packet belongs to. Neither does a normal sniffer. Yet in almost every investigation, that’s the first question!
PktmonGUI runs a second, lightweight ETW trace next to Pktmon (kernel network, kernel process and DNS client events) and matches every packet to a process. The PROCESS column shows the name and PID, and the decoder shows the full path, so a familiar name running from an unfamiliar folder stands out immediately. Because the path is taken from the process-start event, even something that lives for a few milliseconds, like a quick curl command, keeps its path.
It also handles DNS properly. Most programs don’t send their own DNS queries; the DNS Client service does it for them, so in a normal capture - every lookup belongs to svchost. PktmonGUI reads the service’s own record of each query and names both sides, for example: svchost (Dnscache) for chrome.exe. Search for a process and you get its lookups, as well as its connections.
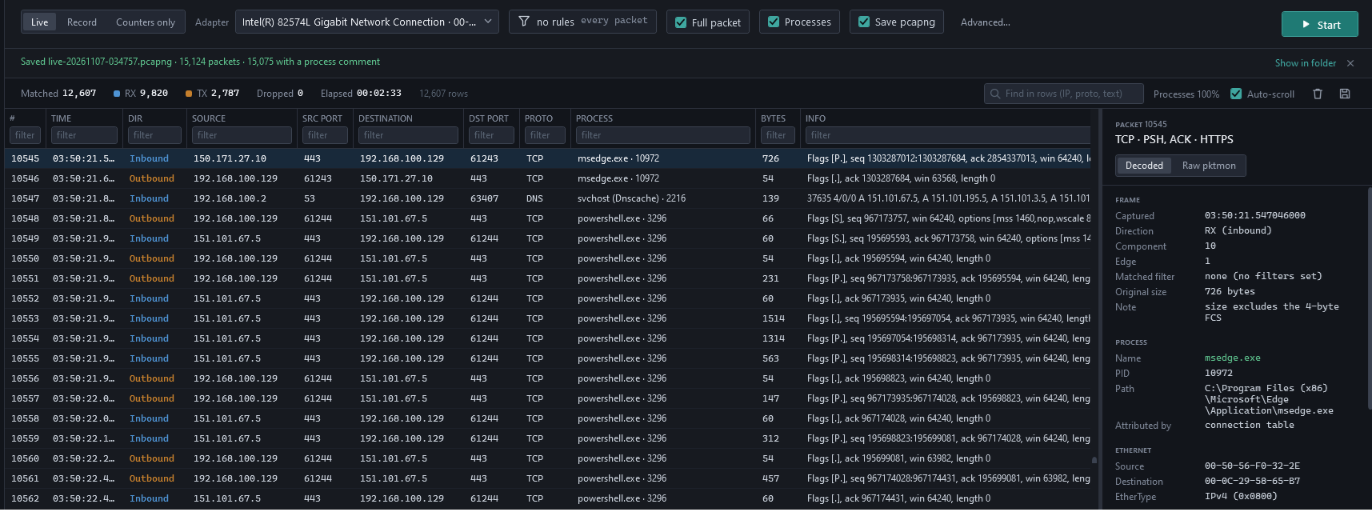
The attribution goes one step further, and travels with the capture: it’s written into the pcapng as packet comments, and a small Lua post-dissector in the Github repo turns those into proper Wireshark fields (procmeta.name, procmeta.pid, procmeta.fullpath) you can add as columns or filter on.

It shows what a sniffer can’t
Because it builds on Pktmon, PktmonGUI gives you drops with their reasons, per-component counters, and captures at specific layers of the stack. The Counters page puts SYNs sent next to SYN-ACKs received, so connection attempts that never got an answer are obvious at a glance, and per-rule counters flag traffic that only flows in one direction. For the “is the firewall eating this, or is it never arriving?” kind of question, that’s often the whole answer.
It’s a good citizen on a shared machine
If Defender for Endpoint has its own Pktmon filters on the box (they’re named SenseNdr…), applying yours with plain Pktmon silently removes theirs. PktmonGUI makes that visible: it tells you whose filters are there, saves them to a snapshot before touching anything, and puts them back when you stop or close it. If it crashes, the next launch notices the leftover session and the saved filters, and offers to restore both.
It starts the same way. Every launch opens on a “Preflight” page that checks elevation, existing sessions, the working folder and existing filters, and changes nothing until you click “Continue”.
It doesn’t hide Pktmon from you
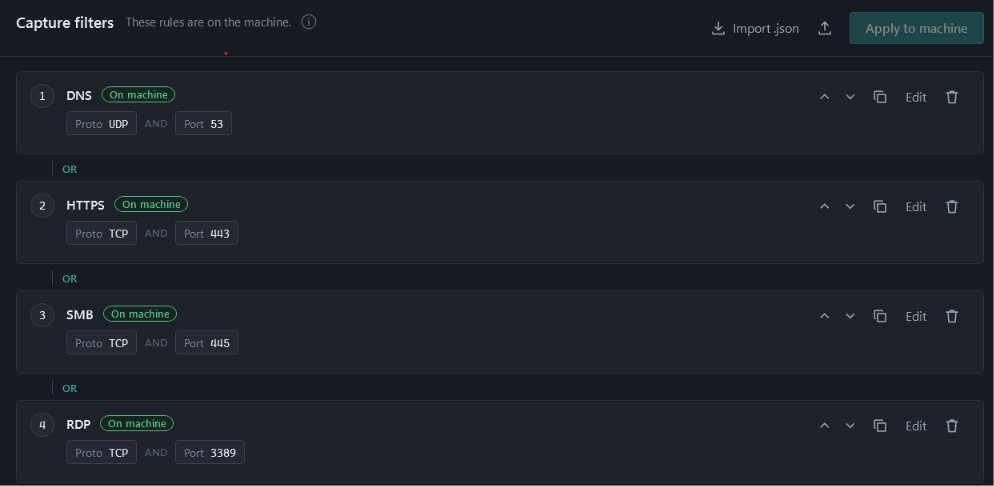
Every page lists the exact Pktmon commands it ran or is about to run. The filter builder reads your rules back as a plain-English sentence, so the AND-within-a-rule, OR-between-rules logic is never a guess. You can use PktmonGUI as a GUI (even as a way to learn Pktmon), or as a generator for commands you then paste into your own scripts.
It scales past one machine
The same executable has a headless mode. That means you can run it with arguments and there’s no window: it records, restores the machine’s filters, converts the capture, and hands back one zip file per host containing the .etl file, a pcapng with process comments, counters, a full command log and a result.json with proper exit codes.
That makes it usable from Group Policy, Configuration Manager, WinRM or PsExec, and the repository includes a PowerShell script that runs captures across many hosts in parallel and collects the results with hash checks.
It takes its own privileges seriously
A tool that runs as administrator, or as SYSTEM, should be careful about what it trusts. PktmonGUI can open Wireshark (if one is installed on the machine) and its text viewer as the signed-in user without elevation, so a parser bug there can’t run as admin. A settings template next to the exe is only used if nobody but an administrator could have written it. Output folders that other accounts could tamper with are refused. Captures are written where only administrators and SYSTEM can read them, because full packets contain whatever crossed the wire unencrypted.
What it isn’t
Being clear about this saves everyone time.
- It isn’t a Wireshark replacement
The live view explains what Pktmon prints, which is a text summary, not a full dissection. For real protocol analysis, open the capture in Wireshark. PktmonGUI gets you there in one click; it doesn’t try to be it. - It can’t capture by process
Pktmon has no process filter. PktmonGUI can show you only one process’s packets, but the capture still contains everything your filters let through. - It isn’t a monitoring sensor
It’s built for troubleshooting sessions, not always-on collection. Pktmon records at line rate: at 100 Mbit/s of full packets, the default 512 MB circular file holds less than a minute. You narrow captures with filters and snap length, or you plan your disk. - It doesn’t run on older Windows
It needs Windows 10 2004 or later, or Server 2022 or later. Server 2019 ships an older Pktmon without what PktmonGUI needs. - Wi-Fi is second class
Live capture works, but Pktmon’s conversion to pcapng is documented for wired Ethernet, and Wi-Fi recordings may not open cleanly in Wireshark. - Pktmon’s filters are simple
Up to 32 rules, no negation, no port ranges, no source-versus-destination. If you think in BPF, expect to adjust (The grid’s display filters, which don’t affect the capture, do support ranges, subnets and exclusions).
Who it’s for
- Windows admins and blue-teamers who need to see traffic on a machine where installing a capture stack isn’t an option, or isn’t worth the change request.
- Network engineers who know Windows and want Pktmon’s layer and drop visibility without memorizing its syntax.
- Incident responders who need “What talked to that IP, and from which binary” answered on a live box.
- Anyone who wants to learn Pktmon properly, with the commands in front of them the whole time.
Try it out
What started as a weekend POC gave birth to a cool new tool, which I’ve kept on fine-tuning and adding features to.
Download PktmonGUI.exe from the project’s GitHub releases (or build it from source), put it in a folder only administrators can change, such as C:\Program Files\PktmonGUI, and run it. The “Preflight” page in the tool checks the machine, you pick an adapter, optionally add a preset (like DNS or TCP resets), and click “Start”. Packets stream into the grid with their processes beside them; click “Stop”, and opening it in Wireshark is one click away.
The full user and admin guide covers the rest, from layer-by-layer captures to fleet deployment.