Pktmon: Windows' Native Packet Sniffer – Part 1/2
- 1 Pktmon: Windows' Native Packet Sniffer – Part 1/2
- 2 Pktmon: Windows' Native Packet Sniffer – Part 2/2
You’re on a live host mid–investigation, and you need to see what’s actually leaving that network interface. Maybe it’s a suspicious process phoning home, maybe it’s an AD authentication issue and you need to watch the Kerberos exchange happen in real time. The instinct is always the same: get Wireshark on the box!
And then you remember you can’t.
Change control won’t approve a new kernel driver on a production server. The client’s security policy explicitly prohibits installing packet-capture tooling on tier-0 infrastructure. You’re on a domain controller where “let’s just install something” is not a sentence anyone wants to say out loud.
As it turns out, Microsoft had quietly shipped an answer to this a while back; they just didn’t advertise it enough: a native, signed, zero–install packet capture tool that’s already sitting on every current Windows host! It’s called Pktmon, and it deserves a place in every blue-team and malware-analysis toolkit.

1. A Brief (And Slightly Embarrassing) History
Network Monitor (Netmon), 1990s-2010
Originally codenamed “Bloodhound”, Netmon came out of the LAN Manager team and was Microsoft’s first real packet analyzer, later shipped as a standalone download (Netmon 3.x) with its own parser engine and capture format. It was capable, but it was a bolt-on tool – a separate install, a separate driver, a separate GUI paradigm from anything else in the OS.
Message Analyzer (MMA), ~2013–2019
Network Monitor was replaced by Microsoft Message Analyzer, which tried to generalize the concept – not just packets, but arbitrary structured “messages” (ETW events, log lines, packets) fused into one timeline and query surface. Architecturally interesting, but it was too heavy to handle, and Microsoft pulled the plug on it by 2019.
The Gap
Between MMA’s retirement notice and pktmon getting any real documentation, admins were back to netsh trace – which produces ETL output that’s genuinely painful to work with without third–party conversion, or dropping a real sniffer (WinPcap/Npcap–based) onto boxes where you may not want a new kernel driver (especially on servers, DCs or anything change-controlled).
Enter Pktmon
Packet Monitor (PktMon.exe) is a built-in network traffic analyzer that was introduced in Windows 10 1809 and Windows Server 2019. It shipped quietly – essentially unannounced for a long time – as a component–level diagnostic tool for a specific pain point: with the rise of Hyper–V, container networking and SDN, the networking stack stopped being “NIC → filter drivers → TCP/IP”, and became a much longer chain of virtual switches, vSwitch ports, WFP filters, and vNICs. Netmon/Wireshark-class tools only ever saw the end of that chain. Pktmon, on the other hand, can tap every component in between.
While the early build (1809, OS build 17763) was “rough” – ETL-only output, no PCAPNG support, no real–time monitoring, the implementation was substantially expanded in the Windows 10 2004 generation (build 19041), which is when PCAPNG conversion and practical real-time monitoring actually became usable.
Let us note that if you find a pktmon tutorial from 2019 that doesn’t work on your current build, this is why; the CLI syntax changed meaningfully between the 1809 and 2004 implementations, so don’t copy-paste old blog commands without checking pktmon start -help against your build first.
2. What Pktmon Actually Is Under the Hood
Pktmon isn’t a raw-socket or NDIS-promiscuous-mode capture tool in the WinPcap sense. It’s an NDIS lightweight filter that registers observation points at multiple layers of the stack – physical NIC, NDIS, the Hyper-V virtual switch and its ports, WFP callout points and TCP/IP itself – and correlates what it sees across those points via ETW (Microsoft-Windows-PktMon). That’s the entire reason it exists: it provides visibility within the networking stack in virtualization scenarios like container networking and SDN, where the traditional networking stack has multiplied in complexity. A traditional NIC-level capture tells you a packet arrived or left; pktmon can tell you it arrived, got processed by the vSwitch, hit a WFP filter, and was dropped there –with a reason code.
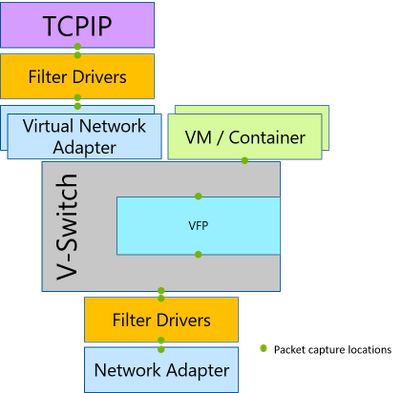 Courtesy: learn.microsoft.com
3. Blue-Team Use-Cases
- Capture on hosts where you can’t or won’t install a third-party sniffing driver
Domain controllers, tier-0 infrastructure, change-controlled production servers – installing Npcap mid-incident means a new signed driver, a service, a footprint you now have to explain and remove. Pktmon is already there, already signed by Microsoft, and requires no install. Great for live incident response! - Remote, scriptable capture at scale
Pktmon can be configured for remote monitoring through PowerShell remoting or WinRM, letting you capture and analyze traffic on remote machines and integrate the output into existing pipelines. That makes “start capture on these 40 hosts, wait 5 minutes, pull everything back” a basic script, instead of an RDP-and-manually-run-Wireshark exercise. - Loopback traffic
NIC-based capture tools generally can’t see 127.0.0.1 traffic at all. Because pktmon taps the stack above the NIC, loopback and inter-process-on-localhost traffic is visible – useful when you’re chasing a service that’s misbehaving talking to something on the same box (e.g.: a local proxy, WSL2 networking issues). - Diagnosing silent drops
The kind of drops that a SPAN port or Wireshark will never show you. If host-based firewall (WFP), a vSwitch ACL or a routing decision is eating packets before they ever leave the box, no amount of upstream mirroring helps. Pktmon’s drop-reason reporting surfaces exactly which internal component ate the packet and why.
4. Malware Analysis Use-Cases
- Reduced anti-analysis fingerprint
Many malware samples check for the presence of analysis tooling before doing anything interesting – such as the presence of “wireshark.exe”, “procmon.exe”, “npf.sys”/”npcap.sys” drivers loaded, “sandboxie” artifacts, and so on. Pktmon is a native Windows component; there’s no new driver to enumerate, no unusual process name to string-match against, no SYSTEM\CurrentControlSet\Services\npcap key to check. For dynamic analysis in a VM, you’re trying to keep “clean-looking”; this is a real advantage over dropping Npcap into the sandbox image. - Living-off-the-land collection during triage
This is the same rationale as the Blue-Team case: on a host you suspect is already compromised, you generally don’t want to be copying new tools onto disk; you don’t know what the attacker’s persistence or file-integrity monitoring looks like from their side, and every new binary you drop is something you now have to account for in your own chain of custody. Pktmon lets you get a packet capture off a suspect host using only what’s already there.
5. Tool Limitations
• Local-host visibility only
Pktmon does not do promiscuous-mode capture of a broadcast domain. It primarily observes traffic and events on the local Windows computer where it runs; to investigate traffic between other devices, you still need a capture on another endpoint, a mirror port or a TAP. This is not a SPAN-port replacement.
• No native GUI, no live dissection
You’re working from ETL/text/PCAPNG output. Pktmon can convert ETL captures to PCAPNG for Wireshark, but Wireshark remains the better tool for graphical dissection, display filters, conversation views and TCP-stream reconstruction. Pktmon is a collector, not an analyzer.
• Default truncation
Pktmon captures only the first 128 bytes of each packet by default, unless you explicitly set full-packet capture (which is easy to forget mid-incident and end up with unusable payload data on exactly the capture you needed).
• Requires local administrator
It’s a post-compromise or authorized-admin capability, not something reachable from a low-privilege foothold – which matters both operationally (you need elevation to run it) and for the detection angle (its presence in logs implies an elevated actor).
• No built-in retention/rotation policy
Only circular/multi-file logging modes. If you want long-term network telemetry, you’re building the pipeline (SIEM ingestion, scheduled pulls) yourself.
• Syntax churn across builds
As noted, 1809-era and 2004+-era syntax diverge meaningfully. Don’t assume a command from an old blog post works verbatim on your current build; verify against pktmon <verb> help first.