Pktmon: Windows' Native Packet Sniffer – Part 2/2
- 1 Pktmon: Windows' Native Packet Sniffer – Part 1/2
- 2 Pktmon: Windows' Native Packet Sniffer – Part 2/2
What’s the TL;DR? - Pktmon is like TCPDUMP, but for Windows.
This post will demonstrate some of the capabilities Pktmon has to offer.

One can verify if Pktmon exists on the system, by opening an elevated command prompt (i.e.: open CMD as an Administrator) and running the command:
pktmon status
If no error message is shown – the tool is available on the system, and one should see the output: “Packet Monitor is not running”.
1. Getting the Tcpdump Feel On Windows
First, we must find the “internal network adapter ID” for the network adapter we wish to capture traffic from. If we don’t specify the ID, we will be capturing multiple duplicates of each network packet captured.
We can locate the ID by issuing the command:
pktmon list
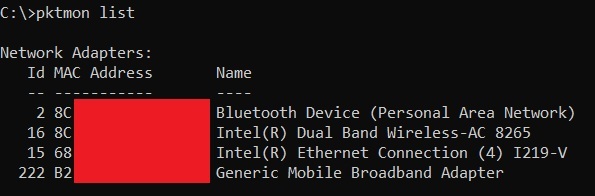
In our example, we would like to capture traffic from the “Ethernet Connection” NIC (id 15).
Let us note that this ID may change between reboots, so always check before running a capture.
If we wish to capture all the traffic from our network adapter, we can issue the following command:
pktmon start -c -m rt -s 16 --pkt-size 0 –-type flow --comp 15
where:
- –c
Short for –capture. Enables packet capture and packet counters (as opposed to just event tracing). Without it, pktmon start collects only ETW events, not packets. - -m rt
Short for –log-mode real-time. Streams parsed packets straight to the console as they’re captured, rather than writing silently to a binary .etl file you’d have to convert afterward. This is the tcpdump-like “watch it happen live” mode. - -s 16
Short for –file-size 16. Sets the log file size cap to 16 MB. Even in real-time mode, pktmon still writes an underlying .etl file in parallel – 16 MB is documented as the practical minimum; if you omit -s, it defaults to 512 MB, which is wasteful for a quick live look. - --pkt-size 0
Pktmon defaults to 128 bytes truncation per packet (fine for headers/flow analysis, not fine if you need full payload). Adding “–pkt-size 0” captures complete packets. - –-type flow
Pktmon defaults to all events (both flow and drop events); if you only care about live traffic and not drop diagnostics, add this flag to cut down the noise. - --comp 15
Restricts capture to component ID 15 specifically, rather than the default all (every registered component: NICs, vSwitch ports, WFP, etc.). You get that ID frompktmon list.
Once you run the command, you start to see events on the console. Use CTRL + C to stop the capture at any moment.
Every captured frame consists of two lines of output data – the first line gives general information about the packet, while the second line will include details of the packet content.
When running pktmon in a Powershell terminal, the “extra” line per packet can be removed by piping to the following cmdlet:
pktmon start -c -m rt -s 16 --pkt-size 0 --type flow --comp 15 | Select-String -Pattern "PktGroup" -NotMatch
2. Building Network Filters
Filter are a set of rules which describe what content we want to collect. To list the current filters, we run the command:
pktmon filter list
To remove all filters, we run the command:
pktmon filter remove
Let us note that this command will always remove all filters; you cannot remove individual filters from the list.
Let’s look at a few examples:
- Filtering by IP address:
pktmon filter add -i 192.168.10.10 - Filtering by IP range:
pktmon filter add -i 192.168.214.0/24. - Filtering by transport protocol:
pktmon filter add -t TCP pktmon filter add -t UDP pktmon filter add -t ICMP - Filtering by port number:
pktmon filter add -p 445We should note the following caveats:
- We cannot add ranges of ports, nor can we have “negative” filters (such as “NOT ICMP”).
- Multiple rules are treated as “OR” statements. That means that the filter set will interpret each filter line as an “OR” statement regarding any other line.
For example:pktmon filter add -t TCP pktmon filter add -i 192.168.10.10 pktmon filter add -p 445Will filter for any TCP packet or any packet with the IP address 192.168.10.10 or any packet with the port 445. In order for the filters to be treated as “AND” statements, they must be entered on the same filter line.
3. Packet Capture for Wireshark Analysis
The initial file format Pktmon uses to store captured traffic data is the ETL format. Don’t worry, Pktmon knows how to convert this format to a PCAP file.
We start by running a command such as:
pktmon start -c --pkt-size 0 --type flow --comp 15 -f c:\temp\capture.etl
The command runs in the background and releases control of the terminal back to us. To check whether packets have yet occurred that match any of the filters, we can run the following command:
pktmon counters
The output will display how many hits (if any) have occurred. It’s also possible to watch the counters increase live:
pktmon counters --live --refresh-rate 1
We can exit the live view using CTRL+C (this won’t end the packet capture itself).
To stop the active capture, we run:
pktmon stop
To convert the ETL file to a PCAP file, we run the command:
pktmon etl2pcap c:\temp\capture.etl -o c:\temp\capture.pcapng
A caveat worth noting here is that the conversion from ETL to PCAP is only possible for packets captured on a wired Ethernet interface – but not a wireless one. Trying to convert a wireless capture will result in a file unreadable in Wireshark.
If you wish to deep dive further into the capabilities and syntax of Pktmon, I urge you to visit Rickard Nobel’s blog post series on the subject.